Safety & Environment
GHG Emissions Reductions
We are committed to reducing our carbon footprint and firmly support efforts by local, state, and federal agencies to reduce greenhouse gas (GHG) emissions. We have reduced our carbon emissions by 49% since 2005. Sixty percent of Con Edison’s annual steam production comes from co-generation, which lowers emissions by one million tons of carbon dioxide (CO2) per year. We work voluntarily with the U.S. Environmental Protection Agency (EPA) to lower emissions of sulfur hexafluoride (SF6) from our electrical equipment. We joined 40 other companies as a founding partner in the EPA’s Natural Gas STAR Methane Challenge Program with the aim of reducing methane emissions. Our residential methane detectors provide customers with a vital warning signal for potential gas leaks. After collaborating with the Environmental Defense Fund, we developed improvements to our leak-detection and repair programs.
We are installing smart meters in our service area, which helps lower carbon emissions through conservation voltage optimization, giving customers just the right amount of voltage they need and not more.
Scope 1: Direct greenhouse gas emissions from CEI-owned or controlled sources (e.g., steam generating stations)
30.4 million metric tons total emission avoided.
We have reduced our carbon footprint by 49 percent since 2005 – the equivalent of taking 500,000 vehicles off the road.
INDIRECT EMISSIONS
|
INDIRECT EMISSIONS |
Indirect emissions – Scope 2 (million metric tons CO₂e) |
Other indirect emissions or Scope 3 total (million metric tons CO₂e) |
|---|---|---|
|
2018 |
1.24 |
35.0 |
|
2017 |
1.35 |
33.9 |
|
2016 |
1.32 |
41.1 |
|
2015 |
1.32 |
41.8 |
|
2014 |
1.09 |
40.9 |
|
2013 |
1.19 |
N/A |
|
2012 |
1.11 |
N/A |
|
2011 |
1.51 |
N/A |
|
2010 |
1.37 |
N/A |
|
2009 |
1.42 |
N/A |
Scope 2: Indirect greenhouse gas emissions associated with delivering products to customers (e.g., electrical transmission losses)
Scope 3: Indirect greenhouse gas emissions associated with customers using CEI products (e.g., customers’ use of delivered gas)
Steam Environmental Efforts

We strive to provide customers with FDA-quality steam, of which 60% is co-generated. Because the steam is co-generated, customers can apply for points toward their Leadership in Energy and Environmental Design (LEED) certification and increase their score in Energy Star’s Portfolio Manager. Our co-generated steam reduces CO2 emissions by approximately 25% of what would have been otherwise emitted through traditional boilers — that’s equal to removing approximately 200,000 vehicles from the road every year. Our customers also benefit from the advantages of steam being a district heating system through the absence of onsite emissions and centralized investments that benefit all customer buildings. The ability of the district system to aggregate a wide variety of customer load profiles also allows for a higher average efficiency than what can be achieved at a single location.
In 2018, the steam system had a slight increase in fuel oil usage levels with 3% fuel oil use and 97% natural gas, versus the 2% fuel oil and 98% natural gas use in both 2016 and 2017. This is a result of the colder winter temperatures experienced and limitations imposed on the natural gas supply system that occur in conjunction. Steam Operations’ 2018 carbon footprint was 110lb CO2/Mlb of steam delivered to customers (1 Mlb = 1,000 lb).
Energy Efficiency Customers' Emissions
Con Edison’s array of energy efficiency initiatives is designed to reduce harmful greenhouse gas emissions, lower customer bills, and give New Yorkers control over their energy choices.
Our customers are as diverse as the city we serve. That’s why we have targeted, cost-effective and customer-centric energy efficiency offerings that emphasize clear benefits and impacts. We focus on four primary customer segments — commercial and industrial, small business, multifamily, and residential — designing offerings to meet each customer group’s needs. This gives our customers multiple options and opportunities to reduce their energy use based on their unique needs.
Electric customers who chose energy-saving HVAC, lighting, building management systems, and other equipment received $65.8 million in incentives in 2018, a 19% increase from the previous year. Our gas customers received $11.1 million in incentives, a 155% increase from the previous year. Technology is giving households and businesses new ways to reduce their energy use, and we’re on the forefront of helping customers get more value for their money, while protecting the environment.
Upgrades made by customers last year through our energy efficiency programs reduced electrical usage by 395,200 megawatt hours and saved 588,100 dekatherms of gas—that’s equivalent to taking more than 66,000 cars off the road, or enough energy to power 37,000 homes for one year. Proposals for new electric and gas energy efficiency programs would put New Yorkers on a path toward a cleaner energy future. Reductions in carbon emissions and more renewable energy options will help New York achieve short-term targets and potentially reach 2050 clean energy goals.
Energy Services partnered with Energy Efficiency to help streamline the distributed generation process and assist customers like never before through customer engagement, technology enhancements, and business process improvement. These improvements helped us achieve a 20% increase in customer satisfaction on large distributed generation projects in 2018. Also last year, Con Edison interconnected 53 MW (about 6,000 cases) worth of distributed energy resources including solar, CHP, fuel cells, and battery storage. A large contributor to this was about 34 MW of residential solar installations.
O&R customers who upgraded to high efficiency energy-saving HVAC, lighting, building management systems, and other equipment received $2.7 million in incentives from us in 2018. As a result of these upgrades, more than 6,000 O&R customers reduced their bills and lowered their carbon footprint. The My ORU Store, our online customer marketplace, provided customers with a one-stop shopping experience and introduced customers to innovative smart home technologies, including smart thermostats, along with a myriad of connected-home products, like Wi-Fi security cameras, smart plugs, wireless dimmable lighting, and electric vehicle chargers. Through My ORU Store, O&R partnered with the local water utility, SUEZ NY, to support their water conservation program by offering instant rebates to mutual customers on water and energy efficient products. The program strives to help customers save water and energy and in turn lower their utility bills.
We are on the forefront of using technology to give households and businesses new ways to reduce their energy use, get more value for their money, while protecting the environment. For example, upgrades made by customers through our energy efficiency programs reduced electrical usage by 24,000 MWh and saved 9,332 dekatherms of gas. This brought our carbon reduction to more than 103,000 tons, which is equivalent to taking more than 22,000 cars off the road.
Of the total O&R rebates issued in 2018, two large projects stand out. One is the city of Middletown in Orange County. The customer upgraded lighting at all their municipal buildings, along with their LED streetlights recently purchased from O&R. The city’s upgrades amount to an estimated savings of 1,685 MWh, which is equal to approximately $225,000 per year. The other customer is a large retail company in Rockland County, who upgraded entirely to LED lighting and is estimated to save 800 MWh, equal to about $95,000 per year.
Learn more about how energy efficiency upgrades can save money and protect the environment at our website www.oru.com/save.
Reduction of SF6 Emissions

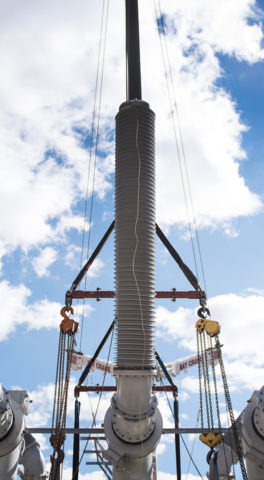
In the past decade, we have greatly reduced emissions of SF6 (sulfur hexafluoride), a greenhouse gas with a warming potential more than 22,000 times higher than carbon dioxide. SF6 is a non-toxic, non-flammable gas that can remain in the atmosphere for up to 3,200 years. There is no viable alternative to SF6, which is a highly efficient insulating medium and arc extinguisher used throughout the energy industry in different types of equipment, including high-voltage breakers and gas-insulated switchgear. But limiting SF6 emissions is imperative for a cleaner environment.
In accordance with a 1999 Memorandum of Understanding between the U.S. Environmental Protection Agency and Con Edison, we agreed to reduce SF6 emissions by 5% annually from a 1996 baseline. In 2018, we released about 97% less SF6 than in 1999, well ahead of our commitment to the EPA. Our reductions in SF6 emissions are achieved through maintenance programs that address SF6 gas leaks and targeted replacement of our equipment. To further limit SF6 emissions, our Fix-It-Now team makes rapid repairs a priority and emphasizes best management practices for gas handling.
Con Edison, Inc. GreenHouse Gas Emissions (million metric tons CO2e)
- 2005
- 2006
- 2007
- 2008
- 2009
- 2010
- 2011
- 2012
- 2013
- 2014
- 2015
- 2016
- 2017
- 2018
- CO23.59
- CH40.4
- SF61.94
- CO23.12
- CH40.4
- SF61.42
- CO23.42
- CH40.39
- SF61
- CO23.2
- CH40.39
- SF60.62
- CO23
- CH40.38
- SF60.42
- CO23.3
- CH40.37
- SF60.25
- CO22.83
- CH40.37
- SF60.18
- CO22.78
- CH40.35
- SF60.18
- CO22.9
- CH40.29
- SF60.17
- OTHER0.03
- CO22.76
- CH40.28
- SF60.16
- OTHER0.07
- CO22.78
- CH40.28
- SF60.13
- CO22.72
- CH40.27
- SF60.11
- CO22.67
- CH40.26
- SF60.08
- CO22.74
- CH40.25
- SF60.08
Methane Challenge
In 2016, Con Edison joined 40 other local distribution companies as a founding partner in the EPA’s Natural Gas STAR Methane Challenge program. The goal of this program is to reduce methane emissions by replacing a significant number of natural gas mains. Our participation in this program was a natural extension of our participation in the Natural Gas STAR program, which we helped found in 1993.
The Natural Gas STAR Methane Challenge program is an EPA/partner company collaboration that promotes and tracks ambitious, transparent commitments to voluntarily reduce methane emissions beyond regulatory requirements.
Our goal was to replace 4% of our cast iron and unprotected steel mains (without cathodic protection) by the end of 2018. Since entering this partnership, we have exceeded that replacement goal by more than six miles the first year, replacing 86.3 miles of main in 2017, which represents 4.3% of our total mains inventory. We also exceeded our 2018 goal of 85 miles by replacing 92 miles of mains, which represents 4.7% of the new total. (Specific details on how we would reach our goals were in our implementation plan, submitted to the EPA in 2016.) As a comparison of how we’ve successfully increased main replacement, between 2014 and 2016 we replaced an average of more than 70 miles of main annually.
Leaks
Con Edison performs gas leak surveys that far exceed the survey interval requirements prescribed by Federal and NY State regulations for identifying natural gas leaks on a timely basis. And to continuously improve our leak survey process, we seek out new leak detection technology. We’re evaluating the ABB MobileGuard™ technology and working with Colorado State University — an expert on methane emissions — to enhance the performance of our survey crews.
In 2016, as part of the gas rate case settlement, we committed to continue our work with the Environmental Defense Fund and others to further enhance our leak detection efforts.
