
Report Introduction
Company Profile
Consolidated Edison, Inc. is one of the nation’s largest investor-owned energy-delivery companies, with approximately $12 billion in revenues and $54 billion in assets. The company provides a wide range of energy-related products and services to its customers through the following subsidiaries:
- Consolidated Edison Company of New York, Inc. (CECONY), a regulated utility providing electric, gas and steam service to customers in New York City and Westchester County, New York
- Orange & Rockland Utilities, Inc. (O&R), a regulated utility serving customers in a 1,300-square-mile-area in southeastern New York State and northern New Jersey
- Con Edison Clean Energy Businesses, Inc. (CEB), which through its subsidiaries develops, owns and operates renewable energy infrastructure projects and provides energy-related products and services to wholesale and retail customers
- Con Edison Transmission (CET), which through its subsidiaries invests in electric and natural gas transmission projects
Revenue by Business (million $)
- 2014
- 2015
- 2016
- 2017
- 2018
- CECONY Electric$8,437
- CECONY Gas$1,721
- CECONY Steam$628
- O&R Electric$680
- O&R Gas$212
- CEBs$1,244
- CECONY Electric$8,172
- CECONY Gas$1,527
- CECONY Steam$629
- O&R Electric$663
- O&R Gas$182
- CEBs$1,383
- CECONY Electric$8,106
- CECONY Gas$1,508
- CECONY Steam$551
- O&R Electric$637
- O&R Gas$184
- CEBs$1,091
- CECONY Electric$7,972
- CECONY Gas$1,901
- CECONY Steam$595
- O&R Electric$642
- O&R Gas$232
- CEBs$694
- CECONY Electric$7,971
- CECONY Gas$2,078
- CECONY Steam$631
- O&R Electric$642
- O&R Gas$249
- CEBs$763
- CET$4
Board Of Directors
Board Of Directors
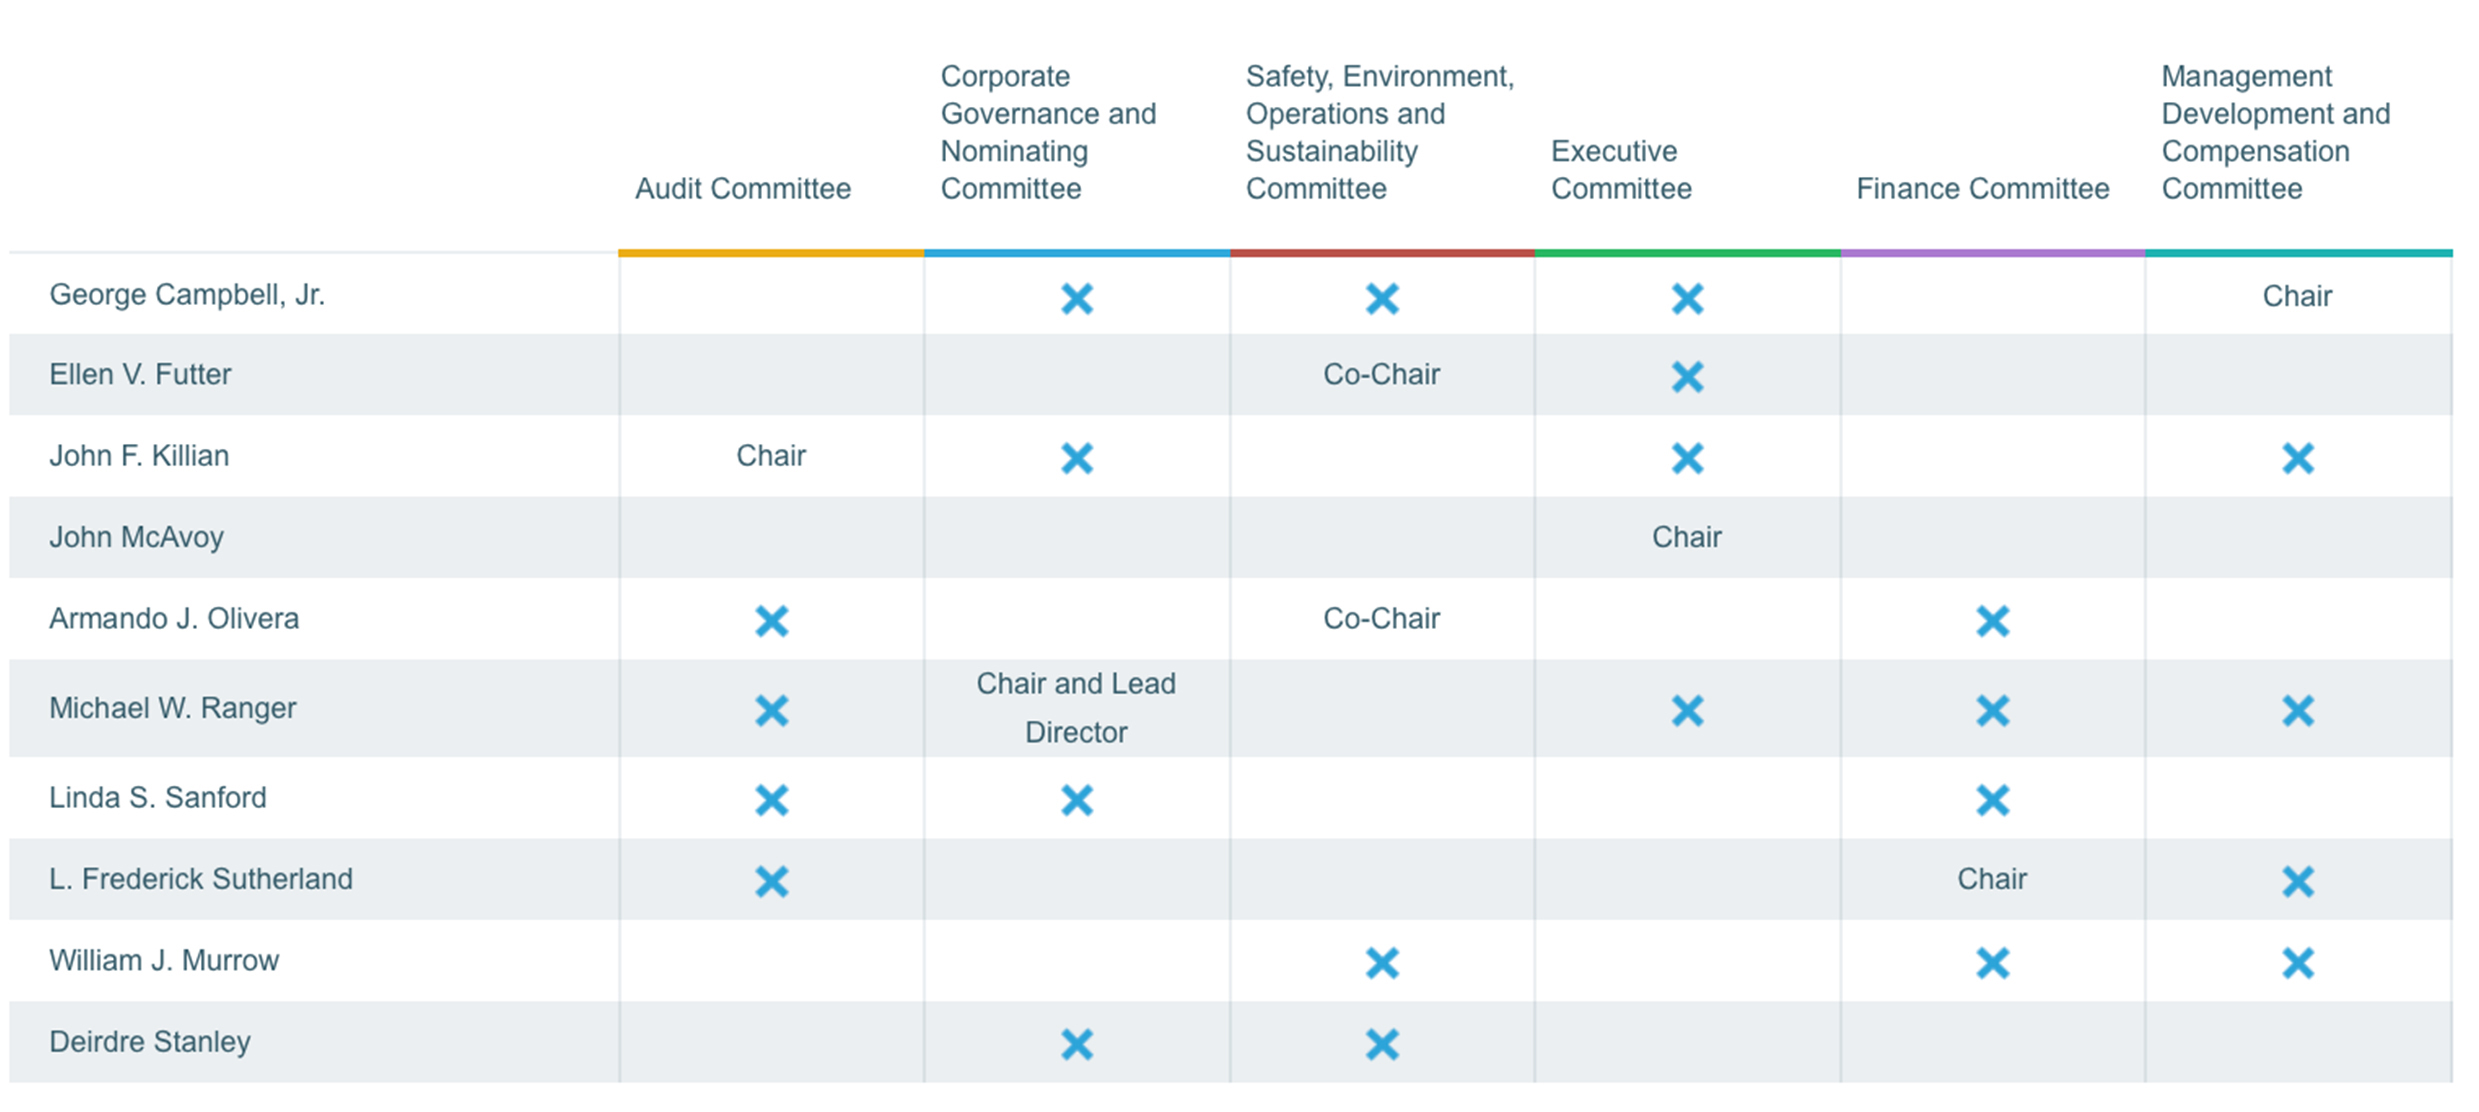
| Audit Committee | Corporate Governance and Nominating Committee | Safety, Environment, Operations and Sustainability Committee | Executive Committee | Finance Committee | Management Development and Compensation Committee | |
|---|---|---|---|---|---|---|
| George Campbell, Jr. |  |
|
|
Chair | ||
| Ellen V. Futter | Co-Chair | |
||||
| John F. Killian | Chair | |
|
|
||
| John McAvoy | Chair | |||||
| Armando J. Olivera | |
Co-Chair | |
|||
| Michael W. Ranger | |
Chair and Lead Director | |
|
|
|
| Linda S. Sanford | |
|
|
|||
| L. Frederick Sutherland | |
Chair | |
|||
| William J. Murrow | |
|
|
|||
| Deirdre Stanley | |
|
| George Campbell, Jr. | |
|---|---|
| George Campbell, Jr. | |
| Corporate Governance and Nominating Committee |
|
| Safety, Environment, Operations and Sustainability Committee |
|
| Executive Committee |
|
| Management Development and Compensation Committee | Chair |
| Ellen V. Futter | |
| Ellen V. Futter | |
| Safety, Environment, Operations and Sustainability Committee | Co-Chair |
| Executive Committee |
|
| John F. Killian | |
| John F. Killian | |
| Audit Committee | Chair |
| Corporate Governance and Nominating Committee |
|
| Executive Committee |
|
| Management Development and Compensation Committee |
|
| John McAvoy | |
| John McAvoy | |
| Executive Committee | Chair |
| Armando J. Olivera | |
| Armando J. Olivera | |
| Audit Committee |
|
| Safety, Environment, Operations and Sustainability Committee | Co-Chair |
| Finance Committee |
|
| Michael W. Ranger | |
| Michael W. Ranger | |
| Audit Committee |
|
| Corporate Governance and Nominating Committee | Chair and Lead Director |
| Executive Committee |
|
| Finance Committee |
|
| Management Development and Compensation Committee |
|
| Linda S. Sanford | |
| Linda S. Sanford | |
| Audit Committee |
|
| Corporate Governance and Nominating Committee |
|
| Finance Committee |
|
| L. Frederick Sutherland | |
| L. Frederick Sutherland | |
| Audit Committee |
|
| Finance Committee | Chair |
| Management Development and Compensation Committee |
|
| William J. Murrow | |
| William J. Murrow | |
| Safety, Environment, Operations and Sustainability Committee |
|
| Finance Committee |
|
| Management Development and Compensation Committee |
|
| Deirdre Stanley | |
| Deirdre Stanley | |
| Corporate Governance and Nominating Committee |
|
| Safety, Environment, Operations and Sustainability Committee |
|
Effective January 1, 2019.
Financial Highlights (million $ except per-share information and statistical data)
|
Financial Highlights |
2014 |
2015 |
2016 |
2017 |
2018 |
|---|---|---|---|---|---|
|
Operating revenues |
$12,919 |
$12,554 |
$12,075 |
$12,033 |
$12,337 |
|
Net income for common stock |
$1,092 |
$1,193 |
$1,245 |
$1,525 |
$1,382 |
|
Basic earnings per common share |
$3.73 |
$4.07 |
$4.15 |
$4.97 |
$4.43 |
|
Dividends per share |
$2.52 |
$2.60 |
$2.68 |
$2.76 |
$2.86 |
|
Dividend payout ratio |
68% |
64% |
65% |
56% |
65% |
|
Average common shares outstanding |
292.9 |
293 |
300.4 |
307.1 |
311.7 |
|
Total assets |
$44,071 |
$45,642 |
$48,255 |
$48,111 |
$53,920 |
|
Capital expenditures |
$2,721 |
$3,418 |
$5,235 |
$3,606 |
$5,249 |
|
Common equity ratio |
52.2% |
52.1% |
49.3% |
51.1% |
49.0% |
|
Return on equity |
8.8% |
9.3% |
9.1% |
10.4% |
8.8% |
|
Market capitalization |
$19,300 |
$18,800 |
$22,100 |
$26,100 |
$24,500 |
|
Stock price per share (year end) |
$66.01 |
$64.27 |
$73.68 |
$84.95 |
$76.46 |
|
Dividend yield (year end) |
3.8% |
4.0% |
3.6% |
3.2% |
3.7% |
|
Total shareholder return |
24.8% |
1.4% |
18.9% |
19.3% |
(6.6%) |