
Customer & Community
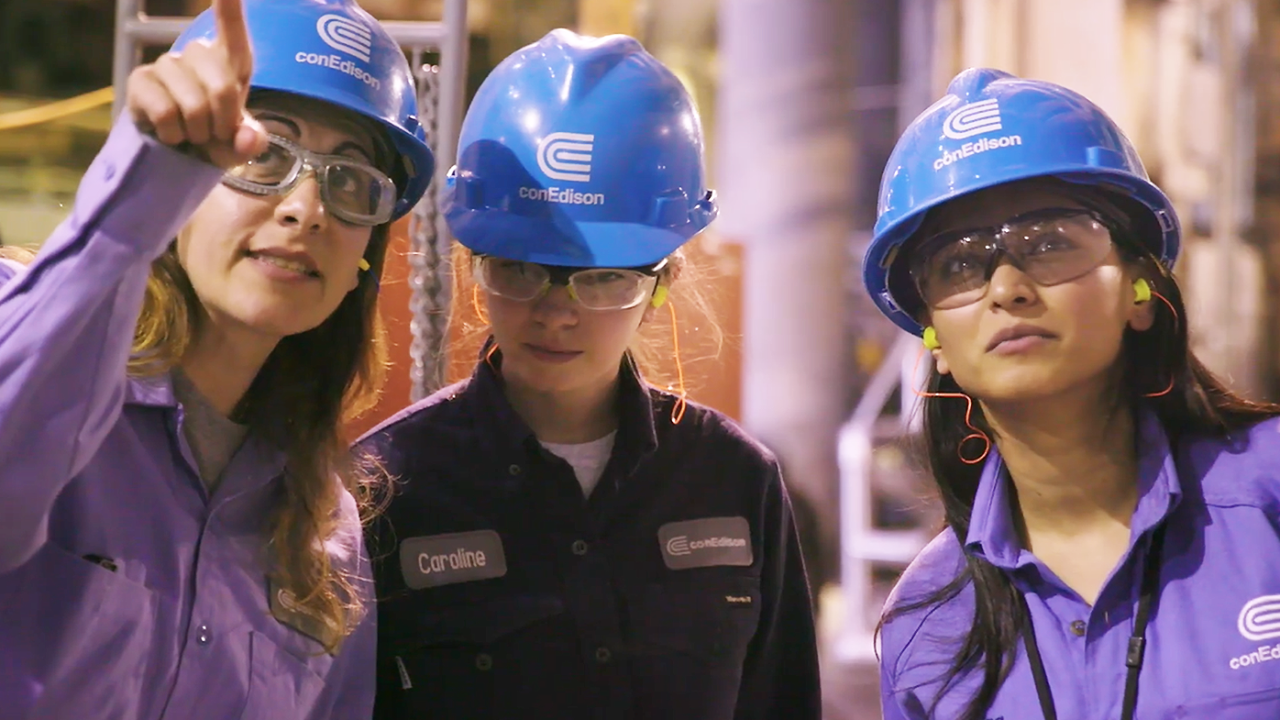
Workforce Diversity & Inclusion
Con Edison benefits from a diverse talent pool by virtue of doing business in one of the most dynamic regions in the world, where people come from all over the globe to live and work.
It takes a conscious and sustained effort to cultivate a workplace where people in our diverse workforce feel safe, valued, included, and able to contribute to his or her full potential. Inclusion is neither simple, nor does it happen based on a one-time change. Rather, creating and maintaining an inclusive culture is an ongoing process that requires continuous self-reflection and improvement, and this is what we are doing.
We continue to look for new ways to ensure that everyone is included. Every person’s unique voice, talent, background, capability, and culture must be acknowledged, valued, and nurtured for the good of our customers and our company. Diversity and inclusion empower us all to see more clearly, think more broadly and engage more fully as we evolve, innovate, and imagine the future ahead.
Hispanic Network magazine named us one of its Best of the Best of the nation’s top companies. Latina Style selected us as one of the 50 best companies for Latinas. We earned a place on Black Enterprise magazine’s list of the top 50 companies for diversity.
To learn more, read our 2019 Diversity & Inclusion Report.
Diversity
|
Diversity |
2014 |
2015 |
2016 |
2017 |
2018 |
|---|---|---|---|---|---|
|
Total workforce |
14,637 |
14,805 |
14,941 |
15,255 |
14,955 |
|
Management |
5,866 |
5,983 |
6,151 |
6,430 |
6,424 |
|
Union |
8,771 |
8,822 |
8,790 |
8,825 |
8,531 |
|
Minorities in the workforce |
6,733 |
6,890 |
7,025 |
7,317 |
7,220 |
|
Minority share |
46% |
47% |
47% |
48% |
48% |
|
Women in the workforce |
2,946 |
3,009 |
3,063 |
3,210 |
3,179 |
|
Women share |
20% |
20% |
21% |
21% |
21% |
|
General Managers, Directors and Above |
240 |
255 |
253 |
266 |
270 |
|
Minorities in GMs, Directors and Above |
68 |
77 |
75 |
78 |
78 |
|
Minority Share |
28% |
30% |
30% |
29% |
28% |
|
Women in GMs, Directors and Above |
69 |
78 |
77 |
82 |
84 |
|
Women Share |
29% |
31% |
30% |
31% |
31% |