


Con Edison, Inc. (CEI) is one of the nation’s largest investor-owned energy companies, with over $12 billion in annual revenues and more than $40 billion in assets. The principal business segments of Con Edison, Inc. are Consolidated Edison Company of New York, Inc. with regulated electric, gas, and steam utility activities; Orange & Rockland Utilities, Inc. with regulated electric and gas utility activities; and Con Edison’s competitive-energy businesses. Con Edison, Inc. is headquartered in New York City with virtually all its revenues generated in the United States. Con Edison, Inc. is traded on the New York Stock Exchange, ticker symbol ED.
Con Edison’s competitive-energy businesses participate in segments of the electricity industry that include electric generation from renewable sources, trading of electricity and fuel, sales of electricity to wholesale and retail customers, and sales of certain energy-related goods and services. For more information, please visit the CEI website, conEdison.com.
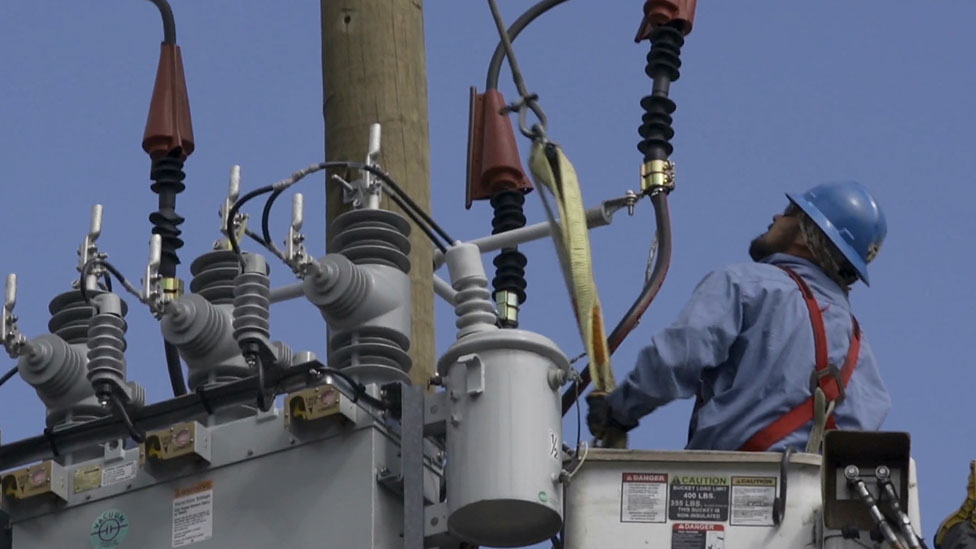
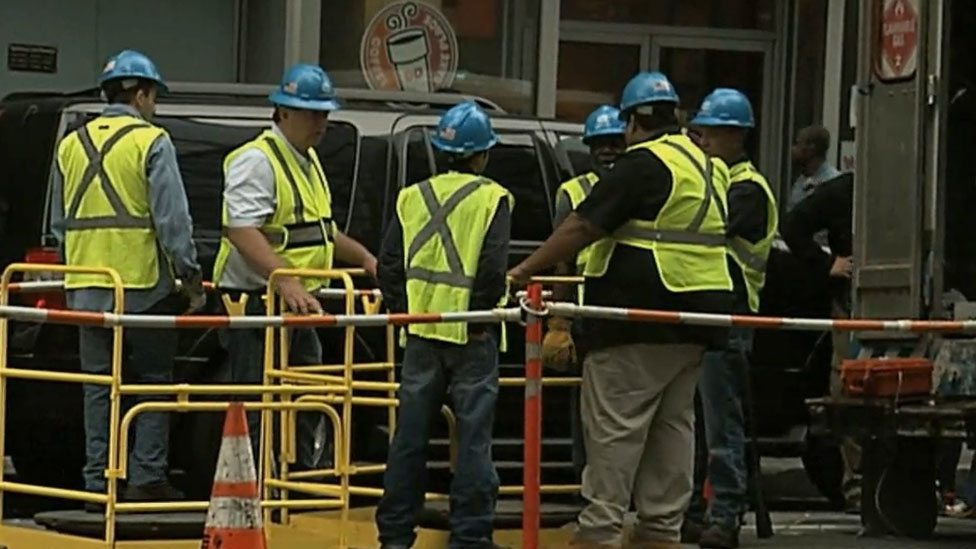
Con Edison of New York (CECONY) is CEI’s largest subsidiary. It is a regulated utility providing electric service throughout New York City (except for a small area of Queens) and most of Westchester County. Con Edison of New York also provides natural gas service in Manhattan, the Bronx, and parts of Queens and Westchester.
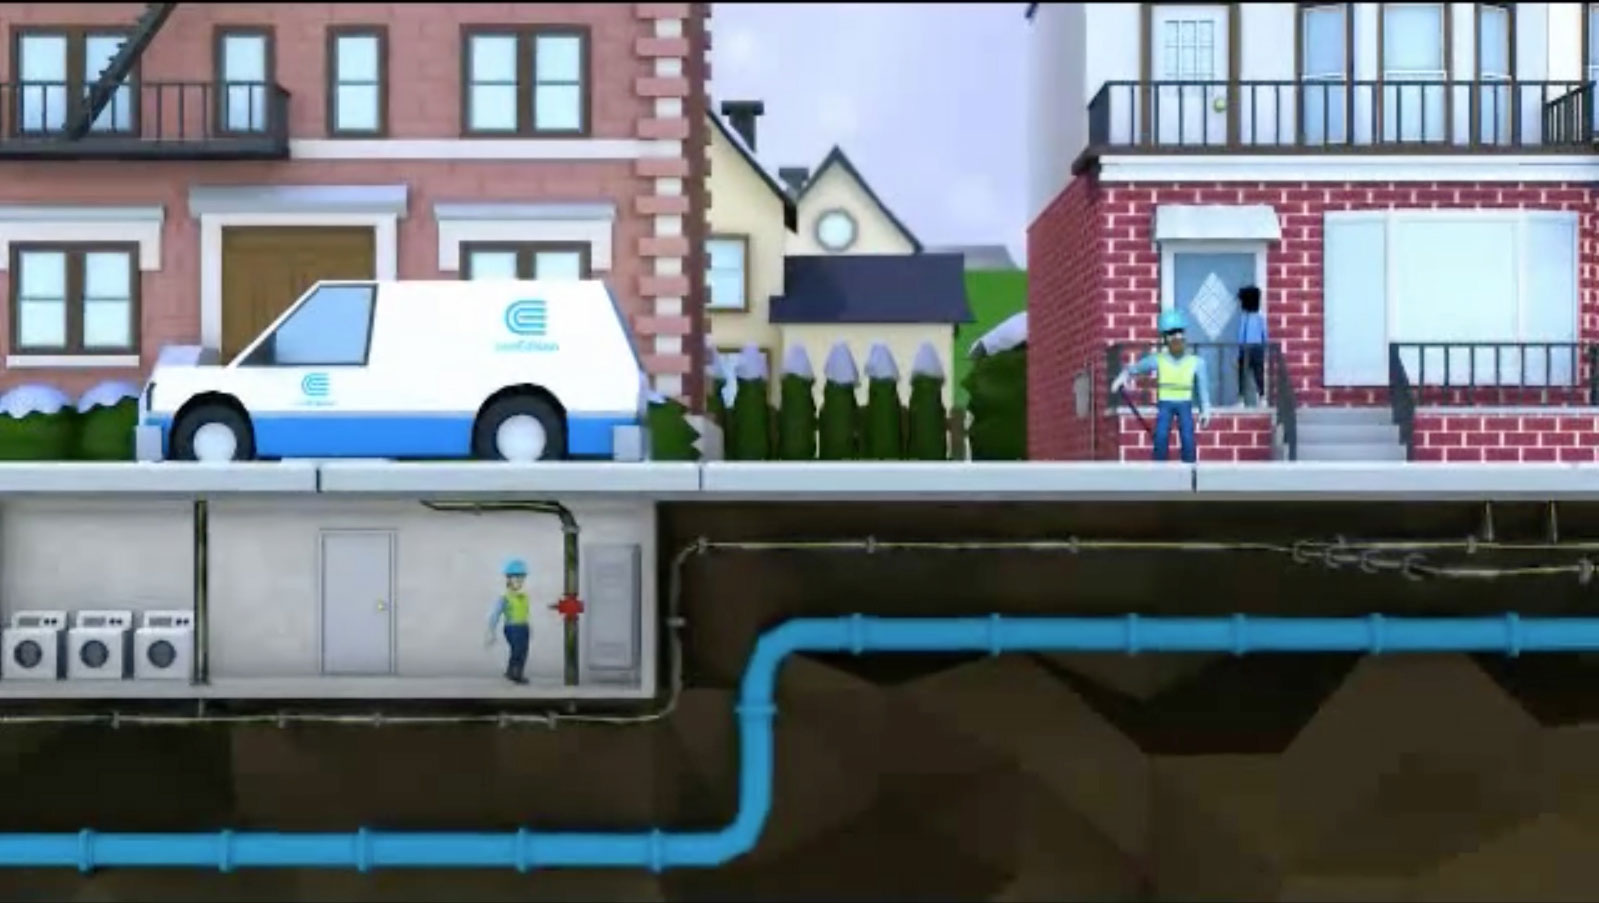
Con Edison of New York operates one of the world’s largest steam distribution systems, providing service for 1,700 customers in Manhattan south of 96th Street. Steam is used year-round, for heat and hot water in the winter, and for air-conditioning in the summer.
Overall, CECONY serves a population of nearly 10 million and more than 50 million annual visitors to New York City, throughout a service territory covering 660 square miles. Selected information on the scale of Con Edison of New York operations is provided in the following table. For more information visit the CECONY website, conEd.com.
Orange and Rockland (O&R) is a wholly owned CEI-regulated subsidiary, headquartered in Pearl River, New York, that delivers both electricity and natural gas in southeastern New York and northeastern Pennsylvania, and electricity in northern New Jersey. Within its tri-state service territory, O&R provides service to a population of roughly 740,000 in a service territory of approximately 1,350 square miles. Selected O&R characteristics are presented in the table below. For more information, visit the O&R website, oru.com.
Con Edison Solutions (CES) is a leading energy services company that provides competitive power supply, renewable energy, sustainability services, cost-effective energy-efficiency solutions, and performance contracting services for commercial, industrial, residential, and government customers nationwide. The company is based in Valhalla, New York, with offices in Burlington, Massachusetts; Cherry Hill, New Jersey; Chicago, Illinois; Falls Church, Virginia; Houston, Texas; Tampa, Florida; and Overland Park, Kansas. The company offers innovative products, financial stability, and a commitment to customer service. The firm's dedicated team of energy professionals delivers a broad range of energy solutions. Con Edison Solutions offers programs and services designed to help customers achieve their individual energy objectives. It is accredited as an Energy Services Provider (ESP) by the National Association of Energy Service Companies (NAESCO).
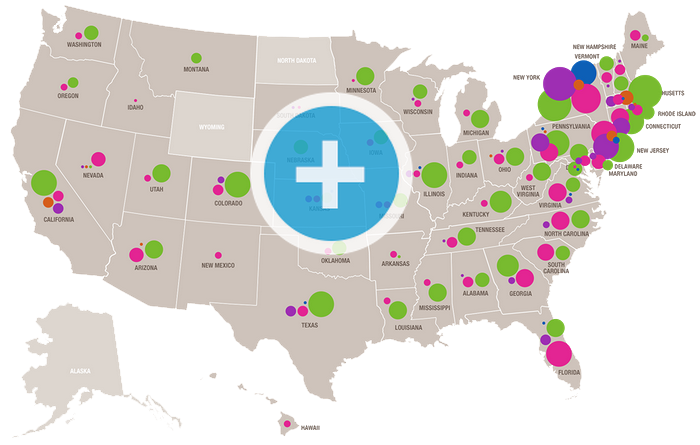
Con Edison Solutions serves retail electric commodity customers in New York, New Jersey, Massachusetts, Connecticut, New Hampshire, Maryland, Delaware, Pennsylvania, Texas, Illinois, Maine, Rhode Island, Ohio, and the District of Columbia, and retail gas commodity customers in New York and New Jersey. For more information, visit the CES website, conedsolutions.com.
Con Edison Development (CED) is a leading developer, owner, and operator of renewable and energy infrastructure projects with a primary, but not exclusive, focus on grid-connected utility-scale solar facilities located in North America. The company’s investments include: ownership interests in solar energy projects in California, Arizona, Nevada, New Jersey, Pennsylvania, Rhode Island, and Massachusetts, with an aggregate capacity of 392 MW; a gas storage corporation, and an investment in an affordable-housing partnership. Through its deep resources and trusted relationships with a range of energy-related companies, CED continues to build its pipeline of renewable energy projects and opportunistically grow its portfolio. For more information, visit the CED website, coneddev.com.
Con Edison Energy (CEE) manages the output and fuel requirements for over 7,300 MW of third-party generating plants in the northeastern United States. The company also provides wholesale hedging and risk management services to CES and CED. In addition, the company contracts for and optimizes energy assets such as transmission, ISO interfaces, natural gas storage and transportation. For more information, visit the CEE website, conedenergy.com.
| Audit Committee | Corporate Governance and Nominating Committee | Environmental, Health and Safety Committee | Executive Committee | Finance Committee | Management Development and Compensation Committee | Operations Oversight Committee | Planning Committee | |
|---|---|---|---|---|---|---|---|---|
| Kevin Burke |  |
|
|
|
||||
| Vincent Calarco | Chair | |
|
|
||||
| George Campbell, Jr. | |
|
Chair | |
||||
| Michael J. Del Giudice | |
Chair | |
|
||||
| Ellen V. Futter | Chair | |
|
|||||
| John F. Hennessy III | |
|
|
|
||||
| John F. Killian | |
|
|
|||||
| John McAvoy | Chair | |||||||
| Armando J. Olivera | |
|
|
|||||
| Sally H. Pinero | |
|
Chair | |||||
| Michael W. Ranger | |
|
Chair | |||||
| L. Frederick Sutherland | |
Chair | |
| Kevin Burke | |
|---|---|
| Executive Committee | |
| Finance Committee | |
| Management Development and Compensation Committee | |
| Planning Committee | |
| Vincent Calarco | |
| Audit Committee | Chair |
| Corporate Governance and Nominating Committee | |
| George Campbell, Jr. | |
| Corporate Governance and Nominating Committee | |
| Executive Committee | |
| Management Development and Compensation Committee | Chair |
| Operations Oversight Committee | |
| Michael J. Del Giudice | |
| Audit Committee | |
| Corporate Governance and Nominating Committee | Chair |
| Executive Committee | |
| Management Development and Compensation Committee | |
| Ellen V. Futter | |
| Environmental, Health and Safety Committee | Chair |
| Operations Oversight Committee | |
| Planning Committee | |
| John F. Hennessy III | |
| Environmental, Health and Safety Committee | |
| Finance Committee | |
| Operations Oversight Committee | |
| Planning Committee | |
| John F. Killian | |
| Audit Committee | |
| Corporate Governance and Nominating Committee | |
| Management Development and Compensation Committee | |
| John McAvoy | |
| Executive Committee | Chair |
| Armando J. Olivera | |
| Environmental, Health and Safety Committee | |
| Finance Committee | |
| Operations Oversight Committee | |
| Sally H. Pinero | |
| Corporate Governance and Nominating Committee | |
| Environmental, Health and Safety Committee | |
| Planning Committee | Chair |
| Michael W. Ranger | |
| Audit Committee | |
| Finance Committee | |
| Operations Oversight Committee | Chair |
| L. Frederick Sutherland | |
| Audit Committee | |
| Finance Committee | Chair |
| Management Development and Compensation Committee | |
Board committee composition and membership as of July 1, 2014
| 2013 | 2012 | |
|---|---|---|
| Operating revenues | $12,354 | $12,188 |
| Net income for common stock | $1,062 | $1,138 |
| Basic earnings per common share | $3.62 | $3.88 |
| Dividends per share | $2.46 | $2.42 |
| Dividend payout ratio | 68% | 62% |
| Average common shares outstanding | 292.9 | 292.9 |
| Total assets | $40,647 | $41,209 |
| Capital expenditures | $2,648 | $2,538 |
| Common equity ratio | 53.9% | 54.1% |
| Return on equity | 8.9% | 9.8% |
| Market capitalization | $16,200 | $16,300 |
| Stock price per share (year end) | $55.28 | $55.54 |
| Dividend yield (year end) | 4.5% | 4.4% |
| Total shareholder return | 3.8% | (6.7%) |
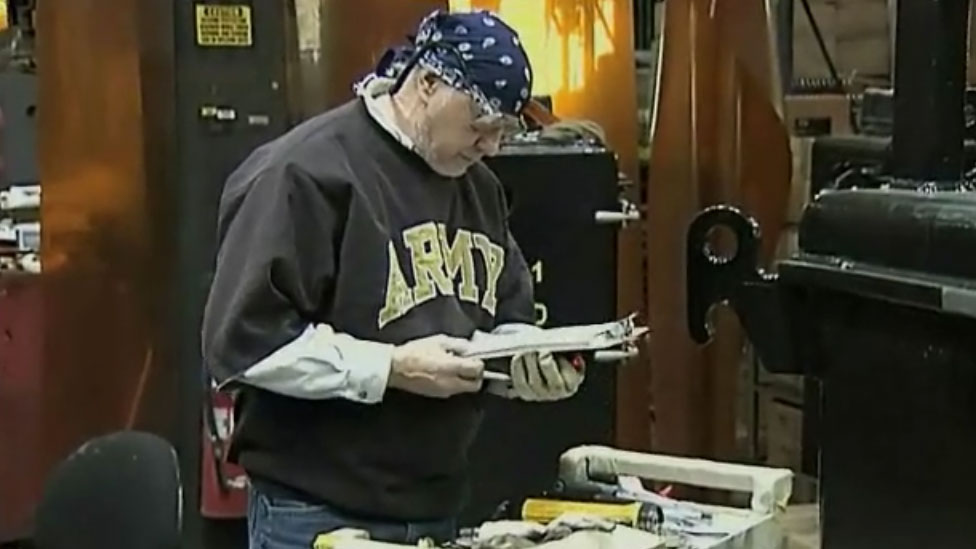
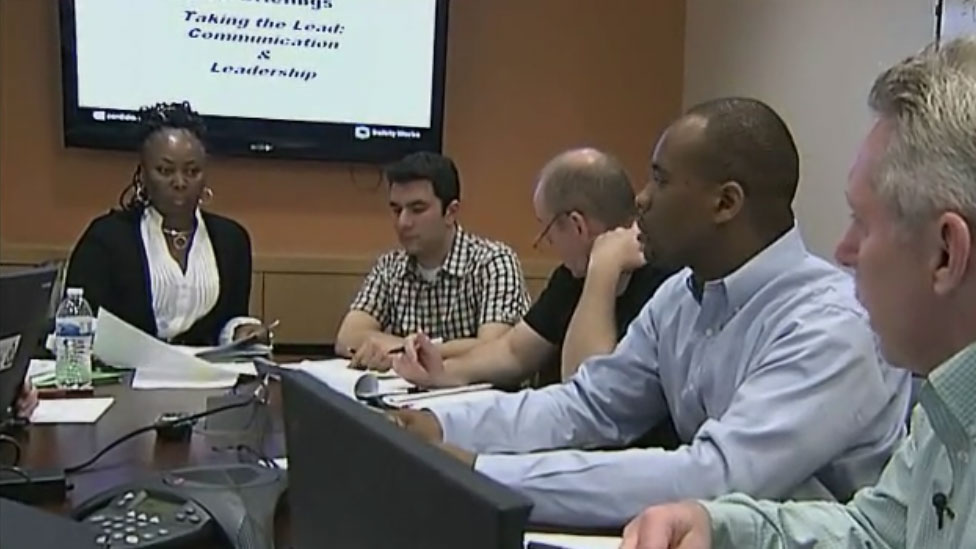
| 565,000 hours of instructor-led, skill-based and leadership training |
| 145,000 hours of eLearning |
| 212,000 hours of documents on-the-job-training |
| 112 employees taking part in a mentoring program |
| 509 employees taking advantage of tuition aid |
| 2013 | 2012 | |
|---|---|---|
| Total workforce | 14,653 | 14,526 |
| Minorities in the workforce | 6,639 | 6,471 |
| Minority share | 45.3% | 44.6% |
| Women in the workforce | 2,942 | 2,791 |
| Women share | 20.1% | 19.2% |
| Officer positions | 59 | 60 |
| Minorities in officer positions | 15 | 15 |
| Minority officer share | 25.4% | 25.0% |
| Women in officer positions | 16 | 14 |
| Women officer share | 27.1% | 23.3% |
| 2013 | 2012 | |
|---|---|---|
| Projects started | 86 | 46 |
| Projects completed | 52 | 78 |
| Budget | $15.9 m | $17.1 m |
Emissions data shown reflects EPA global warming potentials updated in November of 2013
| 2013 | 2012 | |
|---|---|---|
| NOx | 1,898 | 1,618 |
| SO2 | 540 | 509 |
| 2013 | 2012 | |
|---|---|---|
| Scope 3 Total (million metric tonnes) | 39.7 | 39.3 |
| Energy Efficiency Reductions | 234 | 221 |
| Oil-to-Gas PM 2.5 Reductions | 160 | 61 |
| Oil-to-Gas CO2e Reductions | 143 | 71 |
| 2013 | 2012 | |
|---|---|---|
| SPDES Exceedances | 3 | 4 |
| 2013 | 2012 | |
|---|---|---|
| Dielectric fluid released to environment | 23,607 | 27,914 |
| Reportable-quantity chemical spills | 663 | 1,098 |
| Remediation waste | 10,729 | 15,686 |
| 2013 | 2012 | |
|---|---|---|
| Non-hazardous waste generated | 56,245 | 57,310 |
| Non-hazardous waste recycled | 50,718 | 51,571 |
| Hazardous waste generated | 8,718 | 4,601 |
| 2013 | 2012 | |
|---|---|---|
| Facility electric consumption | 280,283 | 332,418 |
| Facility gas consumption | 161,854 | 154,165 |
| 2013 | 2014 | 2015 | 2016 | |
|---|---|---|---|---|
| Electric Substations | $30 | $60 | $70 | $80 |
| Electric Network Dist. | $21 | $72.5 | $60.5 | $52 |
| Electric Overhead Dist. | $19.6 | $15 | $115 | $112 |
| Transformers | $10 | $12.5 | $11.3 | $11.4 |
| Electric Trans. | $3.9 | $4.9 | $2 | $2 |
| Electric / Steam Gen. | $18.4 | $42.8 | $51.5 | $52.3 |
| Gas / Tunnels | $2.1 | $6.8 | $41.6 | $51.7 |
| Telecomm. | $0 | $1.3 | $2.7 | $2.6 |
| Facilities | $0 | $0 | $5 | $5 |
| Electric Substations | |
|---|---|
| 2013 | $30 |
| 2014 | $60 |
| 2015 | $70 |
| 2016 | $80 |
| Electric Network Dist. | |
| 2013 | $21 |
| 2014 | $72.5 |
| 2015 | $60.5 |
| 2016 | $52 |
| Electric Overhead Dist. | |
| 2013 | $19.6 |
| 2014 | $15 |
| 2015 | $115 |
| 2016 | $112 |
| Transformers | |
| 2013 | $10 |
| 2014 | $12.5 |
| 2015 | $11.3 |
| 2016 | $11.4 |
| Electric Trans. | |
| 2013 | $3.9 |
| 2014 | $4.9 |
| 2015 | $2 |
| 2016 | $2 |
| Electric / Steam Gen. | |
| 2013 | $18.4 |
| 2014 | $42.8 |
| 2015 | $51.5 |
| 2016 | $52.3 |
| Gas / Tunnels | |
| 2013 | $2.1 |
| 2014 | $6.8 |
| 2015 | $41.6 |
| 2016 | $51.7 |
| Telecomm. | |
| 2013 | $0 |
| 2014 | $1.3 |
| 2015 | $2.7 |
| 2016 | $2.6 |
| Facilities | |
| 2013 | $0 |
| 2014 | $0 |
| 2015 | $5 |
| 2016 | $5 |
| Openness, fairness and trust |
| Cost consciousness |
| Enhancing stakeholder relationships |
| 2013 | 2012 | |
|---|---|---|
| Green spend | > $3 m | > $3 m |
| Minority / Women-owned Supplier Spend | 288.6 | 323.5 |