MEASURING FOR SUCCESS

Leadership and Strategy

Letter From The Chairman Utility of the Future
Five Business Overview Strategy
Enterprise Risk TimeLine

Managing Our Business

Environmental Performance Safety
Policy Management and Regulatory Impact Governance and Business Ethics
Auditing and ISO Certification Cost Management

Reliability and Resiliency

Reliability Resiliency

Meeting Community Needs

Customers Strategic Partnerships
Employees Shareholders
Supply Chain  


Executive Summary Data snapshot
big_image_3

Environmental Performance

The company’s sustainability strategy is focused on two concepts regarding our environmental stewardship: mitigation and adaptation. From a mitigation standpoint, we strive to reduce our environmental footprint, making wise and effective use of natural resources. We also recognize that our climate is changing and that we must adapt our company to address the challenges of climate change and its impact on our business. We have identified five Key Sustainability Aspects related to our environmental performance and defined success in those areas as follows:

  • Air: Reduce direct and indirect emissions to improve air quality
  • Water: Enhance the efficiency of our water use and seek opportunities to improve water quality
  • Habitat and Biodiversity: Manage our environmental legacy and minimize our impact to natural ecosystems
  • Resource Conservation: Focus on reducing, reusing, and recycling to minimize consumption
  • Climate Change: Design our work in consideration of climate forecasts

The following sections outline our progress in these areas, as well as the goals we look to achieve in the future as we strive to be a good environmental steward and corporate citizen.

Air

Air

Since the 1990s, Con Edison has made significant strides in our efforts to reduce air emissions and our impact on air quality. As outlined in the 2013 IPCC Working Group One report, we recognize that greenhouse gas emissions impact climate change. For that reason, we have made substantial efforts to reduce our direct and indirect emissions of greenhouse gases. The company also continues to make significant progress in the reduction of criteria air pollutants such as nitrogen oxides and particulate matter.

 3 CON EDISON, INC. GREENHOUSE GAS EMISSIONS (MILLION METRIC TONNES CO2E) Array ( [0] => Array ( [line_data] => Array ( [0] => Array ( [x] => 2005 [y] => 0.40 ) [1] => Array ( [x] => 2006 [y] => 0.40 ) [2] => Array ( [x] => 2007 [y] => 0.39 ) [3] => Array ( [x] => 2008 [y] => 0.39 ) [4] => Array ( [x] => 2009 [y] => 0.38 ) [5] => Array ( [x] => 2010 [y] => 0.37 ) [6] => Array ( [x] => 2011 [y] => 0.37 ) [7] => Array ( [x] => 2012 [y] => 0.35 ) [8] => Array ( [x] => 2013 [y] => 0.29 ) [9] => Array ( [x] => 2014 [y] => 0.28 ) ) [line_caption] => CH4 [color] => #1ca4dd ) [1] => Array ( [line_data] => Array ( [0] => Array ( [x] => 2005 [y] => 1.94 ) [1] => Array ( [x] => 2006 [y] => 1.42 ) [2] => Array ( [x] => 2007 [y] => 1.00 ) [3] => Array ( [x] => 2008 [y] => 0.62 ) [4] => Array ( [x] => 2009 [y] => 0.42 ) [5] => Array ( [x] => 2010 [y] => 0.25 ) [6] => Array ( [x] => 2011 [y] => 0.18 ) [7] => Array ( [x] => 2012 [y] => 0.18 ) [8] => Array ( [x] => 2013 [y] => 0.17 ) [9] => Array ( [x] => 2014 [y] => 0.16 ) ) [line_caption] => SF6 [color] => #08b655 ) [2] => Array ( [line_data] => Array ( [0] => Array ( [x] => 2005 [y] => 3.59 ) [1] => Array ( [x] => 2006 [y] => 3.12 ) [2] => Array ( [x] => 2007 [y] => 3.42 ) [3] => Array ( [x] => 2008 [y] => 3.20 ) [4] => Array ( [x] => 2009 [y] => 3.00 ) [5] => Array ( [x] => 2010 [y] => 3.30 ) [6] => Array ( [x] => 2011 [y] => 2.83 ) [7] => Array ( [x] => 2012 [y] => 2.78 ) [8] => Array ( [x] => 2013 [y] => 2.90 ) [9] => Array ( [x] => 2014 [y] => 2.76 ) ) [line_caption] => CO2 [color] => #d95cda ) [3] => Array ( [line_data] => Array ( [0] => Array ( [x] => 2005 [y] => 5.97 ) [1] => Array ( [x] => 2006 [y] => 4.97 ) [2] => Array ( [x] => 2007 [y] => 4.85 ) [3] => Array ( [x] => 2008 [y] => 4.24 ) [4] => Array ( [x] => 2009 [y] => 3.83 ) [5] => Array ( [x] => 2010 [y] => 3.96 ) [6] => Array ( [x] => 2011 [y] => 3.42 ) [7] => Array ( [x] => 2012 [y] => 3.34 ) [8] => Array ( [x] => 2013 [y] => 3.39 ) [9] => Array ( [x] => 2014 [y] => 3.22 ) ) [line_caption] => TOTAL CO2E [color] => #c7c245 ) ) 

CON EDISON, INC. GREENHOUSE GAS EMISSIONS
(MILLION METRIC TONNES CO2E)
 

  • CH4
  • SF6
  • CO2
  • TOTAL CO2E
 pie CON EDISON, INC. GREENHOUSE GAS EMISSIONS (MILLION TONS CO2E) Array ( [0] => Array ( [name] => 2005 [data] => Array ( [0] => Array ( [label] => CO2 [value] => 3.59 [color] => #c56fc6 [param] => on ) [1] => Array ( [label] => CH4 [value] => 0.4 [color] => #1ca4dd [param] => on ) [2] => Array ( [label] => SF6 [value] => 1.94 [color] => #08b655 [param] => on ) [3] => Array ( [label] => OTHER [value] => [color] => #ebad18 [param] => off ) ) ) [1] => Array ( [name] => 2006 [data] => Array ( [0] => Array ( [label] => CO2 [value] => 3.12 [color] => #c56fc6 [param] => on ) [1] => Array ( [label] => CH4 [value] => 0.4 [color] => #1ca4dd [param] => on ) [2] => Array ( [label] => SF6 [value] => 1.42 [color] => #08b655 [param] => on ) [3] => Array ( [label] => OTHER [value] => [color] => #ebad18 [param] => off ) ) ) [2] => Array ( [name] => 2007 [data] => Array ( [0] => Array ( [label] => CO2 [value] => 3.42 [color] => #c56fc6 [param] => on ) [1] => Array ( [label] => CH4 [value] => 0.39 [color] => #1ca4dd [param] => on ) [2] => Array ( [label] => SF6 [value] => 1 [color] => #08b655 [param] => on ) [3] => Array ( [label] => OTHER [value] => [color] => #ebad18 [param] => off ) ) ) [3] => Array ( [name] => 2008 [data] => Array ( [0] => Array ( [label] => CO2 [value] => 3.2 [color] => #c56fc6 [param] => on ) [1] => Array ( [label] => CH4 [value] => 0.39 [color] => #1ca4dd [param] => on ) [2] => Array ( [label] => SF6 [value] => 0.62 [color] => #08b655 [param] => on ) [3] => Array ( [label] => OTHER [value] => [color] => #ebad18 [param] => off ) ) ) [4] => Array ( [name] => 2009 [data] => Array ( [0] => Array ( [label] => CO2 [value] => 3 [color] => #c56fc6 [param] => on ) [1] => Array ( [label] => CH4 [value] => 0.38 [color] => #1ca4dd [param] => on ) [2] => Array ( [label] => SF6 [value] => 0.42 [color] => #08b655 [param] => on ) [3] => Array ( [label] => OTHER [value] => [color] => #ebad18 [param] => off ) ) ) [5] => Array ( [name] => 2010 [data] => Array ( [0] => Array ( [label] => CO2 [value] => 3.3 [color] => #c56fc6 [param] => on ) [1] => Array ( [label] => CH4 [value] => 0.37 [color] => #1ca4dd [param] => on ) [2] => Array ( [label] => SF6 [value] => 0.25 [color] => #08b655 [param] => on ) [3] => Array ( [label] => OTHER [value] => [color] => #ebad18 [param] => off ) ) ) [6] => Array ( [name] => 2011 [data] => Array ( [0] => Array ( [label] => CO2 [value] => 2.83 [color] => #c56fc6 [param] => on ) [1] => Array ( [label] => CH4 [value] => 0.37 [color] => #1ca4dd [param] => on ) [2] => Array ( [label] => SF6 [value] => 0.18 [color] => #08b655 [param] => on ) [3] => Array ( [label] => OTHER [value] => [color] => #ebad18 [param] => off ) ) ) [7] => Array ( [name] => 2012 [data] => Array ( [0] => Array ( [label] => CO2 [value] => 2.78 [color] => #c56fc6 [param] => on ) [1] => Array ( [label] => CH4 [value] => 0.35 [color] => #1ca4dd [param] => on ) [2] => Array ( [label] => SF6 [value] => 0.18 [color] => #08b655 [param] => on ) [3] => Array ( [label] => OTHER [value] => [color] => #ebad18 [param] => off ) ) ) [8] => Array ( [name] => 2013 [data] => Array ( [0] => Array ( [label] => CO2 [value] => 2.9 [color] => #c56fc6 [param] => on ) [1] => Array ( [label] => CH4 [value] => 0.29 [color] => #1ca4dd [param] => on ) [2] => Array ( [label] => SF6 [value] => 0.17 [color] => #08b655 [param] => on ) [3] => Array ( [label] => OTHER [value] => 0.03 [color] => #ebad18 [param] => on ) ) ) [9] => Array ( [name] => 2014 [data] => Array ( [0] => Array ( [label] => CO2 [value] => 2.76 [color] => #c56fc6 [param] => on ) [1] => Array ( [label] => CH4 [value] => 0.28 [color] => #1ca4dd [param] => on ) [2] => Array ( [label] => SF6 [value] => 0.16 [color] => #08b655 [param] => on ) [3] => Array ( [label] => OTHER [value] => 0.07 [color] => #ebad18 [param] => on ) ) ) ) 

CON EDISON, INC. GREENHOUSE GAS EMISSIONS
(MILLION TONS CO2E)

  • 2005
  • 2006
  • 2007
  • 2008
  • 2009
  • 2010
  • 2011
  • 2012
  • 2013
  • 2014
  • CO23.59
  • CH40.4
  • SF61.94
  • OTHER
  • CO23.12
  • CH40.4
  • SF61.42
  • OTHER
  • CO23.42
  • CH40.39
  • SF61
  • OTHER
  • CO23.2
  • CH40.39
  • SF60.62
  • OTHER
  • CO23
  • CH40.38
  • SF60.42
  • OTHER
  • CO23.3
  • CH40.37
  • SF60.25
  • OTHER
  • CO22.83
  • CH40.37
  • SF60.18
  • OTHER
  • CO22.78
  • CH40.35
  • SF60.18
  • OTHER
  • CO22.9
  • CH40.29
  • SF60.17
  • OTHER0.03
  • CO22.76
  • CH40.28
  • SF60.16
  • OTHER0.07
  • Air: DIRECT EMISSIONS

    DIRECT EMISSIONS

    We are committed to curbing our company’s greenhouse gas (GHG) emissions, and have reduced our emissions by 47 percent since 2005 – surpassing our goal to reduce 40 percent of 2005 levels by 2020.  2014 GHG emissions were 7 percent lower than the previous year. The following is an overview of our GHG emissions:

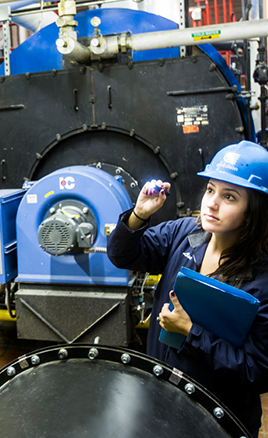
    - Carbon Dioxide: The primary driver of Con Edison’s CO2 emissions is the company’s steam business. In 2014, steam deliveries were 23,017 MMlbs, up from 21,923 MMlbs in 2013. Con Edison of New York produces its steam at the company’s one steam-electric generating station and four steam-only generating stations. We saw a decrease in CO2lbs/MMBTU from 125.22 in 2013* to 121.41 in 2014.

    *Reflects an adjusted 2013 figure  

    In an effort to reduce costs to our customers and meet regulatory requirements pertaining to air quality, the company completed gas addition projects at its 59th Street and 74th Street stations in 2013. 2014 was the first full year of natural gas capability at the stations, and in addition to reducing fuel costs to our customers, CO2 emissions were reduced by more than 150,000 tons.  These projects also contributed to a 17-percent reduction in the nitrogen oxide rate for the company’s steam business.

    Along with efforts to reduce our emissions at the steam plants, Con Edison of New York participates in the Regional Greenhouse Gas Initiative (RGGI) for the emissions from its East River cogeneration plant. The second RGGI compliance period was 2012 – 2014, and during this time, allowances were purchased to cover emissions generated during the compliance period.   Further information on RGGI and Con Edison’s involvement can be found in our Regulatory Impact and Policy Management section.

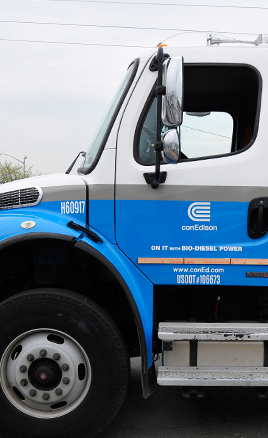
    Finally, Con Edison’s vehicle fleet contributes approximately one percent of the company’s total CO2 emissions. We continue to reduce emissions by using biodiesel fuel, as well as expanding the number of hybrid and alternative fuel vehicles in our fleet. Currently, roughly half of our vehicle fleet is running on some form of alternative fuel or high-efficiency engine.

    - Methane: CH4 is a greenhouse gas with 25 times the heat-trapping potential of CO2. Fugitive methane emissions originate from Con Edison of New York and Orange and Rockland’s natural-gas distribution systems.

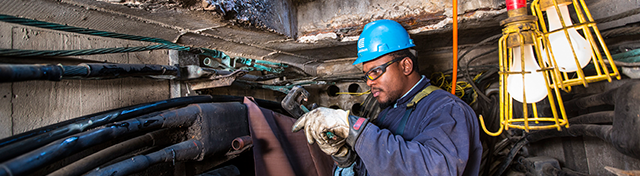
    In 2014, Con Edison of New York replaced approximately 65 miles of leak-prone pipe against an annual target of 60 miles. This achieved the main replacement performance measure required under its current gas rate agreement. Under the terms of its gas rate agreement, Con Edison of New York will be replacing 65 miles in 2015 and 70 miles in 2016. In 2014, O&R replaced over 17 miles of gas main, exceeding the goal to replace no less than 90,000 feet, and reduced active gas leaks to an all-time low.

    Con Edison also replaced 32.3 miles of cast iron main in 2014 compared to a target of 30 miles required under the curent gas rate agreement.  The total gas leak backlog in 2014 was 740 leaks compared to an annual Public Service Commission goal of 950.  Finally, total incoming gas leaks identified in 2014 were 8,717. A total of 10,961 repairs were made resulting in the backlog of 740 leaks described above.  Together, these activities resulted in an estimated reduction in methane emissions of 0.009 million metric tons of carbon dioxide equivalent (based upon greenhouse gas reporting per foot emission factors for pipe materials).

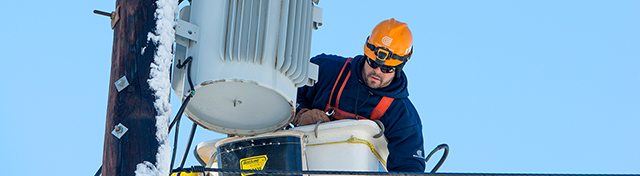
    - SF6: In 1999, Con Edison entered into a memorandum of understanding with the EPA, voluntarily agreeing to reduce its emissions of sulfur hexafluoride (SF6), a colorless, odorless gas used in high-voltage circuit breakers and switches found chiefly in utility substations.

    SF6 emissions from substations were estimated at 15,901 lbs. in 2014, below the 2014 goal of 16,000 lbs. This value represents an approximate 3.6-percent decrease from 2013, and a 92-percent reduction since 2005.

    The company has already surpassed its goal to reduce its emissions below 25,000 lbs. of SF6 by 2020, and is on target to meet its new goal set in 2012 to reduce SF6 emissions an additional 25 percent by 2017.

  • Air: INDIRECT EMISSIONS

    INDIRECT EMISSIONS

    While Con Edison is committed to reducing emissions related to our operations, we recognize that our customers’ emissions also impact the quality of the air throughout our service territory. At the regulated utilities, we are committed to helping our customers find ways that they can reduce their own carbon footprint:

    • The cleanest megawatt is the megawatt that is never produced. Find out more about the energy efficiency offerings in our Customer Energy Efficiency section.
    • Converting customers from oil to natural gas has made significant contributions to cleaner air throughout the city. Find out more about our conversion program in the Customer Oil-to-Gas Conversion section.
    • Renewable generation installations, such as PV solar, are another way customers can reduce their emissions. Visit the Customer Distributed Generation page to find out more about how the utilities are assisting our customers to install and integrate more solar on the grid.

    Additionally, the structure of the New York regulatory system means that other agencies may use money collected from our customers to implement clean technology programs. These include the following:

    • New York State Energy Research and Development Authority (NYSERDA) and New York utilities are responsible for implementing the Energy Efficiency Portfolio Standard (EEPS) that supports energy efficiency, targeted demand-side management, and demand-response programs.
    • NYSERDA is responsible for implementing the Renewable Portfolio Standard (RPS), entering into long-term agreements with developers and paying renewable premiums based on facilities’ energy output.
    • The PSC uses the Systems Benefit Charge to support research and development efforts that serve as a feeder of new technologies to be incorporated into the state’s energy-efficiency and renewable energy programs. This program is also administered by NYSERDA.
  • Air: RENEWABLE GENERATION

    RENEWABLE GENERATION

    We recognize that in order to meet our stakeholders’ desire for cleaner energy, renewable generation must also be a part of the mix. Along with distributed generation initiatives at the regulated utilities, a focus on renewable generation in the competitive businesses is helping us to meet these expectations.

    Con Edison Solutions

    Con Edison promotes renewable energy development by offering renewable energy products through its Con Edison Solutions (CES) subsidiary. This product, called Green Power, consists of 100 percent renewable energy. Residential customers in the state of New York may purchase a mix of 65 percent low-impact hydropower and 35 percent wind energy, or purchase 100 percent wind energy for their full electricity requirements. For commercial customers, CES can supply between five and 100 percent of their electricity requirements with 100 percent wind energy. Con Edison Solutions also offers similar options to residential and business customers in Connecticut and to business customers in Pennsylvania, Massachusetts, New Jersey, New Hampshire, and Texas. Con Edison Solutions Wind Power is Green-e certified. Green-e is a leading national labeling program that sets consumer protection and environmental standards for environmentally superior electricity products.

    In 2014, CES enrolled over 1,500 new customers into these various renewable products, for a total of over 19,000 customers and sales of more than 234,000 MWh.

    In addition to its retail electric Green Power and its energy efficiency services, CES also owns renewable energy projects in Massachusetts, New York, Ohio, California, and New Jersey with an aggregate capacity of 30 MW (AC) which includes 20.4 MW operating and 9.1 MW under construction equaling an estimated annual production of 62 GWh of energy. Included in these numbers is the company’s first wind installation. Two wind turbines at a Honda Motors transmission plant in Ohio now produce approximately 10 percent of the plant’s electricity needs. This is the first major automotive manufacturing facility in the United States to obtain some of its electricity directly from wind turbines located on its property. To learn more, click here. Con Edison Solutions is accredited as an Energy Services Provider (ESP) by the National Association of Energy Service Companies (NAESCO).

    Con Edison Development

    Con Edison Development (CED) completed five solar projects in 2014, totaling 247 MW – bringing the total capacity of solar projects to 568 MW. These assets are located in Nevada, Nebraska, South Dakota, Texas, and California. Con Edison Development has long-term power purchase agreements in place for all these assets.

    Con Edison Development embarked on its first wind project in 2014 when it partnered with Sempra U.S. Gas & Power on the 75-MW Broken Bow II project in Custer County, Nebraska. Under the sales agreement, Sempra U.S. Gas & Power and Consolidated Edison Development holding companies will each own a 50-percent interest in the wind facility. Sempra U.S. Gas & Power will continue to provide operations and maintenance services for the plant, which generates enough renewable energy to power about 30,000 Nebraska homes. To learn more, click here.

    Con Edison Development also acquired another wind project in South Dakota. This 20 MW project generates enough electricity to power approximately 7,000 homes. Con Edison Development also completed three solar projects in Texas, California, and Nevada. These projects deliver a combined 190 MW, or enough electricity to power approximately 30,000 homes.

    Con Edison Development continues to identify opportunities for renewable generation, and to build its renewable energy pipeline. During early development, CED works with local communities, and state and federal agencies. By addressing issues identified early in the process, CED can work with regulatory agencies and other stakeholders to resolve problems before construction begins.

  • Air: REPORTING EMISSIONS

    REPORTING EMISSIONS

    In 2008, Con Edison became a founding reporter of The Climate Registry. The Registry helps organizations calculate and report greenhouse gas emissions, and has developed standardized reporting and third-party verification protocols for creating an inventory of emissions. Con Edison has voluntarily submitted to third-party verification of its greenhouse gas emissions under the registry’s reporting protocols for five consecutive years. The most recent verification of emissions, occurring in 2013, was again verified under the registry’s Electric Power Sector Protocol, which requires disclosure of all direct and indirect sources at company locations. All emissions reports are available on the registry’s website, theclimateregistry.org.

    The company also reports direct emissions through the U.S. EPA Greenhouse Gas Reporting system. In 2014, the company reported emissions from steam and cogeneration stations where fuel is combusted to produce steam and/or electric energy. The company also reported the emissions resulting from the combustion of natural gas delivered to its customers, methane emissions associated with the company’s natural gas delivery system, and SF6 emissions from the company’s electric substations. The company’s reported emissions are accessible through the EPA’s greenhouse gas data publication tool.

    Voluntary reporting was also completed through disclosure to CDP.

chart postition: 1 

Water

We strive to enhance the efficiency of our water use and seek opportunities to improve water quality. Con Edison is the second largest consumer of municipal water in New York, driven by Con Edison of New York’s steam business. In 2013, we consumed 3.6 billion gallons of municipal water, 3.5 billion of which were used to generate steam for heating and cooling customers throughout the city, and approximately 100 million of which was used for basic water and sewage services at our facilities.

Con Edison also uses water withdrawn from the Hudson and East Rivers for cooling at its steam generation plants. This water is returned directly to the river at quality levels specified in SPDES permits with limited to no impact to water quality or quantity as a result of this process. Our withdrawals of river water are reported to the New York State Department of Environmental Conservation on an annual basis as required.

We recognize that we face risks related to water. While parts of the country deal with droughts and concerns about water availability, flooding is a primary concern in the Northeast. Con Edison has made significant investments to mitigate the risk of infrastructure flooding, in preparation for increasingly severe and frequent storms like Hurricane Sandy, which brought historic tidal surges. To learn more, visit the Resiliency section of this report.

chart postition: 2 
 bar-t CON EDISON OF NEW YORK DEP MUNICIPAL WATER USE (BILLION GALLONS) Array ( [0] => Array ( [name] => [data] => Array ( [0] => Array ( [label] => FACILITY USE [color] => #4e83cf [values] => Array ( [0] => Array ( [x] => 2010 [y] => 0.13 ) [1] => Array ( [x] => 2011 [y] => 0.13 ) [2] => Array ( [x] => 2012 [y] => 0.12 ) [3] => Array ( [x] => 2013 [y] => 0.11 ) [4] => Array ( [x] => 2014 [y] => 0.10 ) ) ) [1] => Array ( [label] => STEAM PRODUCTION [color] => #23bdd9 [values] => Array ( [0] => Array ( [x] => 2010 [y] => 3.87 ) [1] => Array ( [x] => 2011 [y] => 3.64 ) [2] => Array ( [x] => 2012 [y] => 3.55 ) [3] => Array ( [x] => 2013 [y] => 3.71 ) [4] => Array ( [x] => 2014 [y] => 3.50 ) ) ) ) ) ) 

CON EDISON OF NEW YORK DEP MUNICIPAL WATER USE
(BILLION GALLONS)

4
3
2
1
2010
0.13
3.87
2011
0.13
3.64
2012
0.12
3.55
2013
0.11
3.71
2014
0.10
3.50
  • FACILITY USE
  • STEAM PRODUCTION

Resource Conservation

The wise and effective use of natural resources is one of Con Edison’s five key EH&S objectives. We have evolved our approach to resource conservation, moving from a focus on waste segregation to a more-encompassing focus on reducing, reusing, and recycling to minimize consumption. This applies to our use of materials as well as our use of energy and water.

  • Resource Conservation: WASTE

    WASTE

    Con Edison’s goal is to manage materials at the beginning of their life cycle, to reduce waste down the line. To do that, we are shifting our employees away from a singular focus on waste segregation, to a broader understanding of resource conservation and materials management. We work to quantify how much reusable material we consume throughout the company, with a focus on the repair and refurbishment of equipment from the transformer shop, the electric and gas meter shops, and our Van Nest fabrication shop. By reconditioning and reusing equipment, we are contributing less to our waste stream, as well as avoiding costs from new purchases. When a material has reached its useful life and we must dispose of it, we first look to recycle it.

    Con Edison of New York minimizes waste and reinforces waste material separation and recycling efforts across the company. A recycling manual, posters located throughout company facilities, training modules, and an internal resource conservation website, all include the various classes of waste found throughout company operations, and procedures for proper handling, collection, segregation, and disposal for each material type. Company facilities contain recycling stations for a variety of waste streams, with clear signage to sort refuse for recycling.

    Orange and Rockland, too, is committed to protecting the environment and conserving natural resources. The company participates in and promotes programs that focus on resource conservation and waste minimization, and continues to explore alternative sustainable practices.

    Orange and Rockland’s recycling program continues a long-standing partnership that employs workers from Rockland ARC, a local organization providing support and services to those with intellectual and developmental disabilities. Supervised ARC workers help to break down retired Orange and Rockland equipment into component parts for re-sale.

    The ARC workers assigned to Orange and Rockland separate waste paper, bale used cardboard, and dismantle old cable, streetlights, reflectors, and meters. O&R then sells those parts to recyclers. The program also provides a useful work experience for ARC of Rockland’s workforce.

    Since the program’s inception in 1991, Orange and Rockland and its

    Rockland ARC partners have recycled more than three million pounds of paper, nearly a million pounds of cardboard, over a million pounds of steel and aluminum wire, and a half million pounds of assorted metals. Orange and Rockland estimates that this program has saved over a million cubic feet of landfill space.


     bar-t CON EDISON OF NEW YORK NON-HAZARDOUS WASTE GENERATION (THOUSAND TONS) Array ( [0] => Array ( [name] => [data] => Array ( [0] => Array ( [label] => LANDFILLED [color] => #7450d1 [values] => Array ( [0] => Array ( [x] => 2010 [y] => 5.8 ) [1] => Array ( [x] => 2011 [y] => 5.7 ) [2] => Array ( [x] => 2012 [y] => 5.7 ) [3] => Array ( [x] => 2013 [y] => 5.5 ) [4] => Array ( [x] => 2014 [y] => 4.8 ) ) ) [1] => Array ( [label] => RECYCLED [color] => #aa7ad3 [values] => Array ( [0] => Array ( [x] => 2010 [y] => 52.6 ) [1] => Array ( [x] => 2011 [y] => 55.3 ) [2] => Array ( [x] => 2012 [y] => 51.6 ) [3] => Array ( [x] => 2013 [y] => 50.7 ) [4] => Array ( [x] => 2014 [y] => 54.2 ) ) ) ) ) ) 

    CON EDISON OF NEW YORK NON-HAZARDOUS WASTE GENERATION
    (THOUSAND TONS)

    80
    60
    40
    20
    2010
    5.80
    52.60
    2011
    5.70
    55.30
    2012
    5.70
    51.60
    2013
    5.50
    50.70
    2014
    4.80
    54.20
    • LANDFILLED
    • RECYCLED
  • Resource Conservation: ENERGY

    ENERGY

    We are always looking for ways to improve efficiencies, and we continue to see improvements in the consumption of both electric and natural gas. In 2014, Con Edison of New York used 313.8 billion BTUs of electricity and 155.8 billion BTUs of gas for the purposes of powering, lighting, heating, and cooling company facilities. This represents a 2-percent increase in electrical consumption, and a 4-percent decrease in gas consumption over 2013 totals of 307.6 and 161.9 billion BTUs, respectively.

     bar-s CON EDISON OF NEW YORK 2013 ENERGY CONSUMPTION (BILLION BTUS) Array ( [0] => Array ( [name] => [data] => Array ( [0] => Array ( [label] => ELECTRIC [color] => #4e83cf [values] => Array ( [0] => Array ( [x] => 2009 [y] => 373.1 ) [1] => Array ( [x] => 2010 [y] => 348.9 ) [2] => Array ( [x] => 2011 [y] => 354.7 ) [3] => Array ( [x] => 2012 [y] => 332.4 ) [4] => Array ( [x] => 2013 [y] => 307.6 ) [5] => Array ( [x] => 2014 [y] => 313.8 ) ) ) [1] => Array ( [label] => GAS [color] => #23bdd9 [values] => Array ( [0] => Array ( [x] => 2009 [y] => 144.8 ) [1] => Array ( [x] => 2010 [y] => 125.6 ) [2] => Array ( [x] => 2011 [y] => 165.6 ) [3] => Array ( [x] => 2012 [y] => 154.2 ) [4] => Array ( [x] => 2013 [y] => 161.9 ) [5] => Array ( [x] => 2014 [y] => 148.5 ) ) ) ) ) ) 

    CON EDISON OF NEW YORK 2013 ENERGY CONSUMPTION
    (BILLION BTUS)

    400
    300
    200
    100
    2009
    373.10
    144.80
    2010
    348.90
    125.60
    2011
    354.70
    165.60
    2012
    332.40
    154.20
    2013
    307.60
    161.90
    2014
    313.80
    148.50
    • ELECTRIC
    • GAS
  • Resource Conservation: WATER

    WATER

    At Con Edison, we are committed to the quality and efficiency of water use in our operations. To learn more about our water consumption in 2014, click here.

chart postition: 2 

Habitat and Biodiversity

We aim to reduce our impact on natural ecosystems in order to protect habitats and biodiversity. Our Land and Vegetation Management program was developed, in part, to encourage biological diversity along our overhead transmission rights-of-way (ROW). This is achieved by three primary objectives:

  • Selective management of vegetation to provide a diversified habitat as a means to enhance and maintain a diversified mix of wildlife on the ROW
  • Disposal of wood waste on-site in a manner that provides cover and protection for a variety of birds, mammals, and reptiles
  • Protection of site conditions and plants to encourage reproduction and spreading of desirable grasses, forbs, and shrubs

In 2013, five fine mesh screens were installed to filter fish, eggs, and larvae from the intake of the East River Generating Station. This measure, plus the installation of a dedicated fish-return system, helped to reduce the impact of the plant on the river, in compliance with governing regulations. In 2013, the screens remained, and we monitored to verify the system’s effectiveness.

The fish-return system uses a low-pressure spray wash to gently remove any aquatic organisms trapped on the new fine mesh screens, and delicately return them to the river. The system is currently undergoing tests, and we expect the results to confirm a considerable reduction in our station’s impact on East River aquatic life.

Managing our Legacy

Hazardous substances, including asbestos, polychlorinated biphenyls (PCBs) and coal tar, have historically been used or produced by Con Edison of New York and Orange and Rockland operations. Some of these sites (many of which are no longer owned by the company) still contain measurable levels of materials that are left over from historic operations. We have made substantial investments in investigating and, when necessary, remediating these sites, and we strive to do so with minimal impact to property owners and our neighbors.

We are working closely with local, state, and federal regulatory agencies to identify and address sites that may be impacted by historic operations. A substantial number of sites are addressed under voluntary cleanup programs, where we have committed to minimize adverse impacts on health and the environment. In addition, the company is working closely with the community, keeping the public informed and aware of current projects and programs, through regular meetings, signs and notices, and an informational company website. We work hard to minimize disruptions to the local community, and monitor our impacts on a real-time basis throughout our remediation projects.

The company is held financially responsible under state and federal laws for its impacts to these sites and the remediation of impacted areas. The company sets aside money for the investigation and cleanup of these sites. For more information, please see our annual 10K report.

Many of Con Edison of New York’s current remediation sites were formerly the location of manufactured gas plants (MGP), where the company made and distributed manufactured combustible gas. From the early 1800s to the mid-1900s, Con Edison, like many other utilities of its time, manufactured gas in such plants and distributed it in parts of New York City and in Westchester County. At the time, this gas provided many benefits to the community, including heating homes and businesses, and lighting the city’s streetlamps. However, it is now known that some of the byproducts of this production may be harmful to human health and the environment. Through the end of 2014, investigations were started at all 51 Con Edison of New York MGP Sites, and were completed at all or portions of 32 of those sites. Remedial investigations have been completed at all seven Orange and Rockland MGP Sites. Orange and Rockland has received the New York State Department of Environmental Conservation’s decision regarding the remedial work to be performed at six of those sites, three of which have been completed.

During 2014, Orange and Rockland spent approximately $9 million for its remediation programs, including approximately $8 million for its MGP program, and Con Edison of New York spent approximately $20 million for its remediation programs, including approximately $9 million for its MGP program.


chart postition: 2 

Climate Change

II_A5_Climate_changeCon Edison acknowledges that climate change is a critically important challenge, and we are designing our work in consideration of climate forecasts. Addressing climate change will need to involve all sectors of the economy and all sources of greenhouse gas (GHG) emissions. 

In support of this Key Sustainability Aspect, we have identified seven climate change principles:

  1. Work with federal, state, and local governments, and other stakeholders to address climate change.

  2. Maintain an inventory of the company’s direct and indirect GHG emissions.

  3. Consider the potential impact of business decisions on GHG emissions.

  4. Pursue improvements in energy efficiency in our operations to reduce our GHG emissions.

  5. Advocate, promote, and support energy efficiency improvements among our customers.

  6. Support new technology development in coordination with other key industry stakeholders.

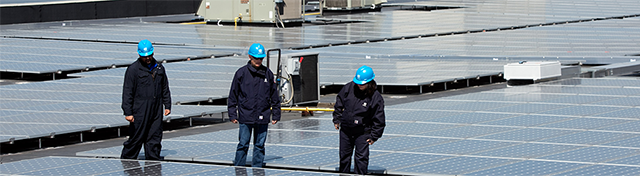
  7. Support development of renewable sources of energy and other generation that reduces emissions, including GHGs.

There are two approaches to handling climate change – adaptation and mitigation. To learn more about our mitigation efforts, visit the Air Quality section of this report. To learn more about our efforts in adaptation, see the Resiliency section of this report.

chart postition: 2 
search map-laptop Videos map-laptop map-ipad map-iphone