Customer & Community
Workforce Diversity & Inclusion
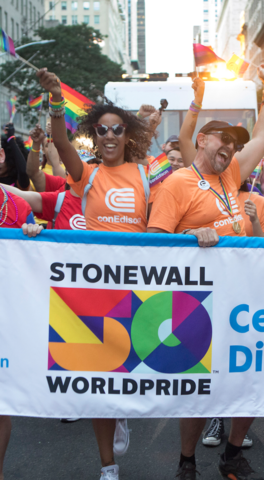
 At Con Edison, an inclusive culture is one that values everyone as an important member of the team. It’s a feeling you have when those around you recognize your importance and want your contributions.
We strive for strong diversity numbers. Equally, we need everyone to feel respected, included, and valued. In other words, diversity ensures a wide range of views, and inclusion makes sure all of those ideas get heard.
Our employees are on the frontlines every day of increasingly higher customer expectations and unprecedented technological change. In addition to delivering safe, reliable energy to more than 10 million people, our employees are making a smarter grid, boosting the use of electric vehicles, and generating more renewable energy for people all around the country. They’re making it easier for our customers to choose cleaner, more efficient energy and have more control over how they use it. A culture of inclusion creates fertile ground for new ideas and innovations that make our energy future bright.
To learn more, read our 2019 Diversity & Inclusion Report.

Diversity
|
|
2014 |
2015 |
2016 |
2017 |
2018 |
2019 |
|---|---|---|---|---|---|---|
|
Total workforce |
14,637 |
14,805 |
14,941 |
15,255 |
14,955 |
14,596 |
|
Management |
5,866 |
5,983 |
6,151 |
6,430 |
6,424 |
6,394 |
|
Union |
8,771 |
8,822 |
8,790 |
8,825 |
8,531 |
8,202 |
|
Minorities in the workforce |
6,733 |
6,890 |
7,025 |
7,317 |
7,220 |
7,080 |
|
Minority share |
46% |
47% |
47% |
48% |
48% |
49% |
|
Women in the workforce |
2,946 |
3,009 |
3,063 |
3,210 |
3,179 |
3,123 |
|
Women share |
20% |
20% |
21% |
21% |
21% |
21% |
|
General Managers, Directors and Above |
240 |
255 |
253 |
266 |
270 |
282 |
|
Minorities in GMs, Directors and Above |
68 |
77 |
75 |
78 |
78 |
80 |
|
Minority Share |
28% |
30% |
30% |
29% |
28% |
28% |
|
Women in GMs, Directors and Above |
69 |
78 |
77 |
82 |
84 |
89 |
|
Women Share |
29% |
31% |
30% |
31% |
31% |
32% |
