Safety & Environment
GHG Emissions Reductions
As evidence of the commitment to reduce our carbon footprint, 60 percent of CECONY annual steam production comes from cogeneration, which lowers emissions by one million tons of CO2 per year. O&R reduced greenhouse gas (GHG) emissions by 40 percent from 1990 levels. We continue to firmly support efforts by local, state, and federal agencies to reduce GHG emissions. For example, we work voluntarily with the Environmental Protection Agency (EPA) to lower emissions of sulfur hexafluoride, or SF6, from our electrical equipment. We have joined 40 other companies as a founding partner in the EPA’s Natural Gas STAR Methane Program. Our residential methane detectors provide customers with a vital warning signal for potential gas leaks. After collaborating with the Environmental Defense Fund, we developed improvements to our leak-detection and repair programs.
In addition to ongoing energy efficiency initiatives that save money for our business and residential customers, we’ll begin installing smart meters this summer in our service area. Smart meters will give customers more information about their energy usage and enable them to manage their bills more efficiently.
Scope 1: Direct greenhouse gas emissions from CEI owned or controlled sources (e.g., steam-generating stations)
Steam Environmental Efforts

We strive to provide customers with FDA quality steam, of which 60 percent is co-generated. Because the steam is co-generated, customers can apply for points toward their Leadership in Energy and Environmental Design (LEED) certification and increase their score in Energy Star’s Portfolio Manager. Our co-generated steam reduces CO2 emissions by approximately 25 percent of what would have otherwise been emitted through traditional boilers—that’s equal to removing 190,000 vehicles from the road every year.
Here is how our customers benefit from an absence of onsite emissions: They see improvements in the Manhattan skyline from our steam-system enhancements, including our decision to modify two steam-generating stations in 2013 to burn natural gas as a primary fuel rather than No. 6 fuel oil. In 2016, this change alone was responsible for a 7-percent reduction in CO2 emissions compared to the 2008–09 average. That’s equivalent to taking 44,000 vehicles off the road annually. Also, the steam system achieved its lowest historical fuel oil usage levels in 2016, using only 2 percent fuel oil and 98 percent natural gas—a direct result of warmer-than-normal temperatures and an infrequent need to switch fuel.
Energy Efficiency Customers' Emissions
Con Edison and O&R continued to excel in energy efficiency, resulting in lower bills for customers, cleaner air, and a solidifying of our No. 1 position for reliable service. We gave customers who chose energy-saving HVAC, lighting, building management systems, and other equipment more than $40 million in incentives. As of April 2017, customers got a discount of up to 50 percent on energy-saving LED light bulbs bought directly from Con Edison Marketplace. For a household that uses 10 LED bulbs for an average of six hours a day, there’s a potential annual energy savings of $121.65 compared to using incandescent bulbs.
We’re offering households and businesses better ways to reduce their energy usage through advice on how to take advantage of programmable thermostats, sophisticated building management systems, the latest in lighting, and other technologies. Upgrades made by CECONY customers through our energy efficiency programs in 2016 reduced electrical usage by 160,200 megawatt hours and saved 266,500 dekatherms of gas. That’s equal to taking more than 23,000 cars off the road. Since 2009, CECONY has paid customers more than $280 million to make upgrades.
Energy Efficiency – Avoided Emissions (thousand metric tons)
| 2016 | 2015 | 2014 | 2013 | 2012 | 2011 | 2010 | 2009 |
|---|---|---|---|---|---|---|---|
| 191.6 | 107 | 118 | 99 | 104 | 94 | 33 | 0.4 |
Con Edison also launched the Connected Homes platform to augment its residential energy efficiency programs. The platform educates customers on their energy usage and provides them with offers for solar panels, home services and products, and connects them with suppliers and retailers through an online marketplace, allows them to compare energy scores, customer reviews, available rebates and pricing of appliances and electronics. Since its launch a year ago, the platform has enabled customers to save over 20,000 megawatt hours of energy.
In 2016, CECONY paid out to $4.9 million to commercial and industrial customers, $19.9 million to small businesses, $10.9 million to owners of multifamily buildings, and $5.1 million to residential customers.
O&R energy efficiency programs lowered electrical usage by 29,422 megawatt hours and saved 10,261 dekatherms of gas—equal to taking 1,181 cars off the road. O&R offered rebates for the construction of a large data center in Orangeburg. Design of the project’s cooling, air, and power supply systems will save the center about $2.8 million a year. O&R rebates for a holistic energy efficiency project at Rockland Community College—which includes LED lighting, energy management and load management systems, and two combined heat and power generators—is expected to save the college $900,000 annually.
O&R also expanded My ORU Store, its online customer marketplace for energy efficiency products and services, by adding home products, LED lighting products, advanced power strips, water-saving products, and home services provided by local contractors.
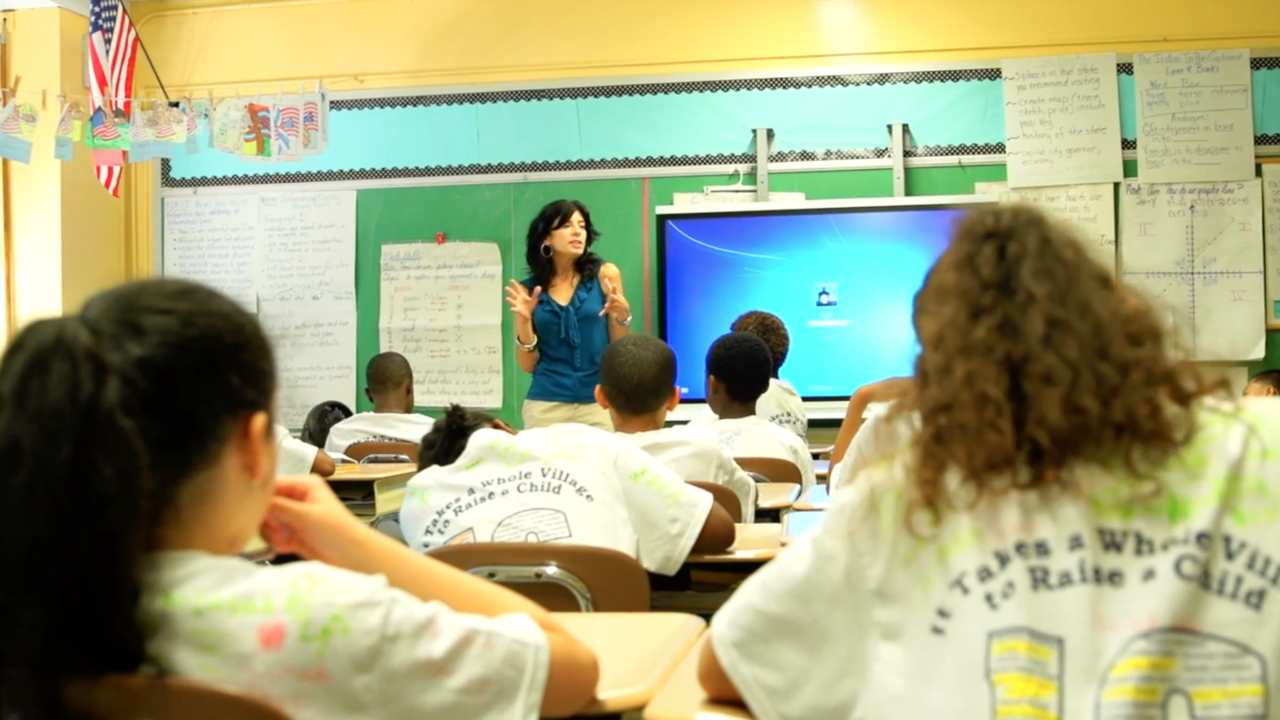
We provide educational and technical assistance to local schools, including a Smart Kids Energy Efficiency program for students on Staten Island:
Learn more about how energy-efficiency upgrades can save money and protect the environment at our Manage Energy microsite.
Learn more about the Connected Homes platform:

Reduction of SF6 Emissions
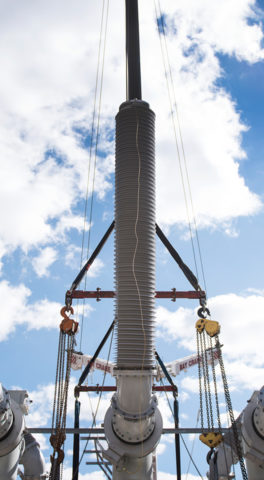
In the past decade, we have greatly reduced emissions of SF6 (sulfur hexafluoride), a greenhouse gas with a warming potential more than 22,000 times higher than carbon dioxide. SF6 is a non-toxic, non-flammable gas that can remain in the atmosphere for up to 3,200 years. There is no viable alternative to SF6, which is a highly efficient insulating medium and arc extinguisher used throughout the energy industry in different types of equipment, including high-voltage breakers and gas-insulated switchgear. But limiting SF6 emissions is imperative for a cleaner environment.
In accordance with a 1999 Memorandum of Understanding between the U.S. Environmental Protection Agency and Con Edison, we agreed to reduce SF6 emissions by five percent annually from a 1996 baseline. In 2016, we released about 96 percent less SF6 than in 1999. Our reductions in SF6 emissions have resulted from maintenance programs that address SF6 gas leaks and targeted replacement of our equipment. To further limit SF6 emissions, our Fix-It-Now team makes rapid repairs a priority and emphasizes best management practices for gas handling.
Con Edison, Inc. GreenHouse Gas Emissions (Thousands of metric tons CO2e)
- 2005
- 2006
- 2007
- 2008
- 2009
- 2010
- 2011
- 2012
- 2013
- 2014
- 2015
- 2016
- CO23.59
- CH40.4
- SF61.94
- CO23.12
- CH40.4
- SF61.42
- CO23.42
- CH40.39
- SF61
- CO23.2
- CH40.39
- SF60.62
- CO23
- CH40.38
- SF60.42
- CO23.3
- CH40.37
- SF60.25
- CO22.83
- CH40.37
- SF60.18
- CO22.78
- CH40.35
- SF60.18
- CO22.9
- CH40.29
- SF60.17
- OTHER0.03
- CO22.76
- CH40.28
- SF60.16
- OTHER0.07
- CO22.78
- CH40.28
- SF60.13
- CO22.72
- CH40.27
- SF60.11
Leaks
In 2015 and 2016, we teamed with the Environmental Defense Fund (EDF) to better measure non-hazardous leak emission rates of methane gas. We are currently field-testing this new technology developed by Colorado State University (CSU) under an EDF-sponsored program.
In 2016, CSU used its technology to rank non-hazardous gas leaks based on their emission rate. Leaks were identified as small, medium, and large emitters. As part of our overall leak-repair program, we repaired 100 percent of all leaks identified as medium or large. We expect to continue to work with the EDF and others to further develop this technology and incorporate it into our leak-repair program.
Methane Challenge
On March 30, 2016, Con Edison joined 40 other local distribution companies as a founding partner in the EPA’s Natural Gas STAR Methane Challenge program. As a founding participant in the Natural Gas STAR program since 1993, we welcomed the opportunity to participate in this new partnership as well.
The Natural Gas STAR Methane Challenge program is a flexible, voluntary partnership that allows the EPA to collaborate with partners to promote and track ambitious, transparent commitments to voluntarily reduce methane emissions beyond regulatory requirements and to recognize partners for their progress.
Our company continues to increase the pace of replacing its cast iron and unprotected steel mains. We exceeded our goal of replacing an average of 65 miles of main annually from 2014 – 2016. With the Methane Challenge Partnership Agreement, we’re committed to increase main replacement activity over the next two years. Our goal is to replace four percent of our cast iron and steel mains (without cathodic protection) each year by the end of 2018. Specific details on how we will reach this goal were in our implementation plan, submitted to the EPA in 2016.
We distribute natural gas to 1.1 million customers in Manhattan, the Bronx, Queens, and Westchester County, making us one of the largest gas distribution companies in the U.S. with 4,375 miles of gas mains and 370,924 service lines.